You’ve probably heard analysts throw around the term “P/E ratio” as if it’s the holy grail of stock analysis. But what is the price-to-earnings ratio (P/E ratio) really telling you — and why should you care as an investor?
Let’s unpack this powerful yet misunderstood metric and learn how to use it intelligently to make smarter investment decisions.
Introduction to the P/E Ratio: Understanding the Basics
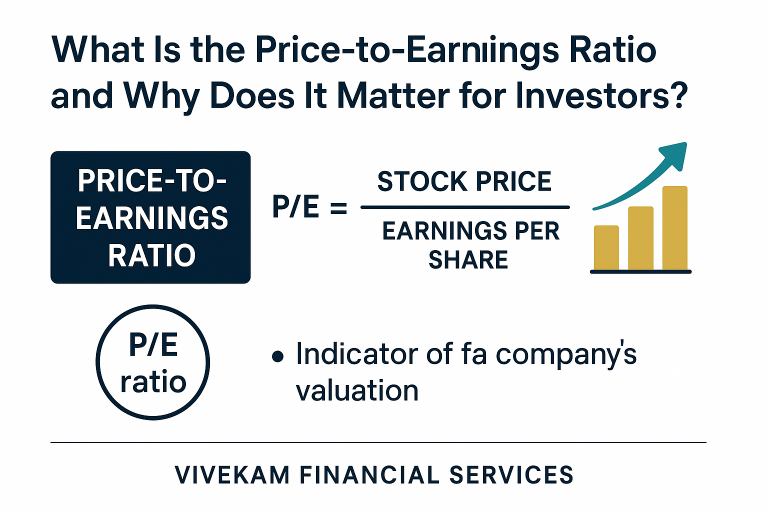
The P/E ratio, or price-to-earnings ratio, measures how much investors are willing to pay today for a company’s past or expected earnings.
P/E Ratio = Price per Share ÷ Earnings per Share (EPS)
It’s a quick way to gauge market expectations.
- A high P/E ratio suggests optimism about future growth.
- A low P/E ratio can signal undervaluation — or a company in trouble.
In short, this ratio helps you answer one question: “Am I paying too much for this stock’s earnings?”
What Is P/E Ratio? Simple Explanation for Beginners
Think of it like this: if a company’s P/E ratio is 15, you’re paying $15 for every $1 of its yearly profit.
A high number often reflects growth expectations; a low one could indicate value — or risk.
This simple yet revealing number is what separates emotional investors from rational ones.
The Role of the Price-to-Earnings Ratio in Stock Market Analysis
In the stock market, the P/E ratio helps investors cut through noise. Instead of chasing hype, it allows you to compare valuations across similar companies and spot market mispricings. It’s one of the most used — and abused — tools in finance.
The P/E Ratio Formula and Its Components
Understanding the P/E Ratio Formula is simple.
P/E Ratio = Market Price per Share ÷ Earnings per Share (EPS)
Each component matters:
- Price per Share reflects market sentiment.
- Earnings per Share (EPS) reflects real profitability.
Together, they tell you how much belief — or skepticism — investors are pricing into a stock.
Step-by-Step P/E Ratio Calculation
Let’s keep it real. If Company A trades at $80 and earns $4 per share, then:
P/E = 80 ÷ 4 = 20
That means investors are paying 20 times last year’s earnings. Whether that’s “expensive” depends on growth prospects and industry norms.
Example: Calculating the P/E Ratio for a Company
If Apple Inc. trades at $180 with an EPS of $6:
P/E = 180 ÷ 6 = 30
A 30x multiple implies the market expects Apple to keep outperforming. Compare that to, say, Ford, with a P/E under 10 — it’s a different story of growth versus stability.
How Earnings Per Share (EPS) Affects the Ratio
The “E” in the P/E ratio carries more weight than most think.
- If EPS falls, but price stays flat — your P/E ratio inflates, signaling overvaluation.
- If EPS rises, the ratio shrinks, suggesting improved value.
Smart investors watch earnings trends, not just the headline ratio.
Types of P/E Ratios: Trailing vs Forward P/E
The P/E ratio isn’t static — it shifts depending on what earnings period you use.
What Is a Trailing P/E Ratio?
The trailing P/E uses actual earnings from the past 12 months.
It’s factual, reliable, and grounded in history — but it says little about the future.
What Is a Forward P/E Ratio?
The forward P/E projects the next 12 months’ expected earnings.
It’s useful for growth forecasts, but since it’s based on analyst predictions, it can be wrong — sometimes wildly so.
Comparing Trailing and Forward P/E Ratios
Metric | Trailing P/E | Forward P/E |
Earnings Basis | Past (actual) | Future (expected) |
Reliability | Higher | Lower (subjective forecasts) |
Use Case | Historical performance | Future potential |
 Savvy investors compare both to check if optimism is justified — or if a correction is coming.
How to Use the P/E Ratio in Investing Decisions
Now that you know the P/E ratio meaning, it’s time to use it like a pro.
Using the P/E Ratio to Evaluate Stock Valuation
A low P/E could mean the stock’s a bargain — or that the company’s earnings are collapsing.
A high P/E might reflect real growth potential — or irrational exuberance.
The trick is context: always compare a company’s P/E to its industry average and historical trend.
Comparing P/E Ratios Across Industries
Different sectors have different “normal” ranges.
- Tech stocks often have P/Es above 30 — high growth, high risk.
- Energy or banking stocks hover around 10–15 — slower growth, steady cash flow.
You can’t compare Tesla’s P/E to Chevron’s — they play by different growth rules.
P/E Ratio and Growth Stocks vs. Value Stocks
Growth investors chase high P/Es betting on future profits.
Value investors hunt for low P/Es, looking for underpriced gems.
Both strategies work — if you interpret the ratio wisely.
 Pro Tip: Combine the P/E ratio with other tools like PEG ratio (P/E to growth), debt ratios, and cash flow analysis for deeper insight.
The Significance of the P/E Ratio in Stock Market Analysis
The significance of the P/E ratio goes far beyond being a simple number. It’s a window into investor psychology, market expectations, and a company’s growth narrative.
For professional investors, the P/E ratio acts as a valuation compass. It reveals how much the market is willing to pay for every dollar of profit — a proxy for trust and optimism in future performance.
How Investors Interpret High and Low P/E Ratios
- High P/E Ratio – Often signals that investors expect rapid growth. Tech firms like Nvidia or Amazon usually fall in this category. However, high P/Es can also indicate overhyped stocks where expectations exceed reality.
- Low P/E Ratio – Suggests undervaluation or market skepticism. For example, cyclical industries like oil or manufacturing might show low P/Es during downturns but later bounce back.
The trick? A “high” or “low” P/E isn’t good or bad in isolation. It’s the story behind the number that matters.
P/E Ratio and Market Sentiment
Market sentiment often swings faster than company fundamentals.
A sudden earnings miss can cause P/E ratios to balloon overnight, while upbeat forecasts can compress them quickly.
That’s why successful investors use the P/E ratio as a sentiment indicator, not just a valuation metric — it tells you how the crowd feels, not only what the balance sheet says.
P/E Ratio Risks and Limitations
While the P/E ratio is valuable, it’s not a crystal ball. Over-reliance on it can lead to false conclusions and costly mistakes.
When the P/E Ratio Can Be Misleading
- Earnings Manipulation: Companies can inflate EPS through buybacks or accounting tactics.
- Cyclical Earnings: During downturns, earnings collapse — pushing the P/E artificially high.
- Loss-Making Firms: Negative earnings make the ratio meaningless. (You can’t divide by zero.)
So, if a company has a P/E of 100+, it doesn’t always mean it’s overvalued — it might just be in a temporary earnings slump.
Sector-Specific Differences and Market Anomalies
Every sector dances to its own tune:
- A P/E of 40 in the tech sector might be “normal.”
- The same ratio in the utility sector would look absurdly overvalued.
Always compare within industries, and never assume that one universal “good P/E” exists.
Alternative Valuation Metrics Beyond the P/E Ratio
To get the full picture, combine P/E with:
- PEG Ratio (Price/Earnings-to-Growth): Adds growth to the equation.
- Price-to-Book (P/B): Evaluates a company’s assets.
- EV/EBITDA: Neutralizes debt effects for better comparability.
The best investors use the P/E ratio as one instrument in a diversified valuation toolkit, not the entire orchestra.
Practical Applications: Real-World Examples of P/E Ratios
Let’s look at how professionals apply this metric in real scenarios.
Case Study: Comparing Tech and Energy Sector P/E Ratios
Company | Industry | Share Price | EPS ($) | P/E Ratio |
Apple (AAPL) | Tech | $180 | $6 | 30 |
ExxonMobil (XOM) | Energy | $110 | $11 | 10 |
Tesla (TSLA) | EV/Tech | $250 | $4 | 62.5 |
In this table:
- Apple’s P/E of 30 shows moderate growth pricing.
- Exxon’s P/E of 10 signals a value-oriented play.
- Tesla’s P/E above 60 reveals intense growth expectations — and higher volatility risk.
Smart investors weigh such comparisons before making a move.
How Professional Investors Incorporate P/E Ratios
Seasoned investors like Warren Buffett and Peter Lynch use the P/E ratio as a starting point, not the final verdict. They:
- Compare current P/E to historical averages.
- Check whether earnings quality is sustainable.
- Evaluate if the price justifies the expected growth rate.
In essence, the P/E ratio in stock market investing becomes a diagnostic tool — helping investors decide if a stock is worth holding, buying, or avoiding.
FAQs About the P/E Ratio
1. What Is the Ideal P/E Ratio for a Company?
There’s no universal ideal. A good P/E depends on the industry, growth rate, and market conditions. Generally, 15–25 is considered moderate for stable companies.
2. Can a Negative P/E Ratio Be Good?
A negative P/E means the company is losing money, so it’s not a useful valuation tool in that case. Look at other metrics like revenue growth or cash flow instead.
3. What Is the Difference Between P/E and PEG Ratios?
The P/E ratio measures price vs. earnings, while the PEG ratio adjusts for growth rate. PEG gives a more balanced view — especially for high-growth firms.
4. How Often Should Investors Check P/E Ratios?
Check quarterly or during earnings seasons. Too frequent tracking may lead to overreactions to market noise.
5. Is P/E Ratio the Only Indicator of Stock Value?
No — it’s just one of many. Combine it with cash flow, debt ratios, and profit margins for a full picture.
6. How Does Inflation Affect the P/E Ratio?
High inflation erodes purchasing power and can compress P/E ratios since investors demand higher returns to offset rising costs.
Conclusion: Why Every Investor Should Understand the P/E Ratio
The price-to-earnings ratio is more than a formula — it’s a lens through which investors view market confidence and corporate performance.
Used correctly, it helps you spot undervalued gems, avoid overpriced hype, and understand how the market values growth and risk.
But remember: numbers tell stories, and context gives them meaning. The P/E ratio is powerful — as long as you read it like a strategist, not a statistician.
For deeper insights on valuation methods, check out Investopedia’s P/E Ratio Guide — a trusted resource for investors worldwide.