What is Debt-to-Equity Ratio and How to Calculate It?
The debt to equity ratio is one of the most widely used financial metrics for evaluating a company’s capital structure and financial risk. At its core, it reveals how much a business relies on borrowed money versus shareholder investment to fund operations and growth.
Understanding What is the Debt to Equity Ratio isn’t just an academic exercise. It directly influences lending decisions, investment choices, and even how companies plan future expansion. A poorly managed ratio can signal financial distress, while a well-balanced one often reflects disciplined leadership.
What is the Debt to Equity Ratio?
Debt-to-Equity Ratio Definition
The Debt-to-Equity Ratio Definition refers to a financial leverage ratio that compares a company’s total debt to its shareholders’ equity. It highlights the proportion of financing that comes from creditors versus owners.
In simple terms, the debt to equity ratio answers this question:
How much debt does the company use for every dollar of equity it owns?
A ratio of 1.0 means debt and equity are equal. Anything higher indicates heavier reliance on borrowing.
Why Debt to Equity Ratio Matters in Finance
The debt to equity ratio matters because it directly reflects financial risk. Debt magnifies returns during good times but increases vulnerability when revenue slows or interest rates rise.
This ratio helps:
- Investors judge long-term sustainability
- Lenders decide credit limits and interest rates
- Management balance growth with solvency
Companies that ignore this metric often discover too late that growth funded by debt can quickly become a liability.
Understanding Debt to Equity Ratio in Simple Terms
Imagine two companies earning the same profit:
- Company A funds growth mostly with equity
- Company B funds growth mostly with loans
If profits fall, Company B still must pay interest. Company A has breathing room. The debt to equity ratio reveals this difference instantly.
Debt to Equity Ratio Formula Explained
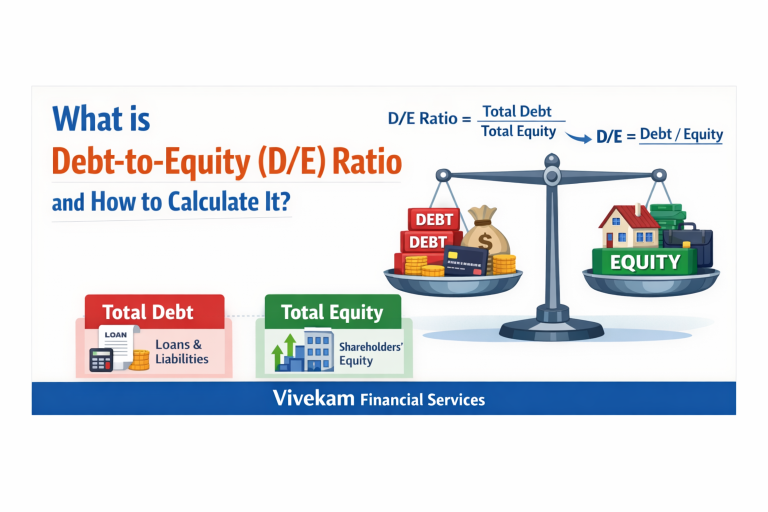
Debt to Equity Ratio Formula
Debt to Equity Ratio= Total Liabilities / Shareholders Equity
This debt to equity ratio formula is straightforward, but its interpretation is where real insight lies.
Components of the Debt to Equity Ratio Formula
What Counts as Total Debt?
Total debt includes all interest-bearing obligations such as:
- Short-term borrowings
- Long-term loans
- Bonds and debentures
Operational liabilities like trade payables are sometimes excluded depending on analysis goals.
What is Shareholders’ Equity?
Shareholders’ equity represents the owners’ residual interest in the business after liabilities are deducted. It includes paid-in capital, retained earnings, and reserves.
How to Calculate Debt to Equity Ratio (Step-by-Step)
To understand how to calculate debt to equity ratio, follow these steps:
- Locate total liabilities on the balance sheet
- Identify shareholders’ equity
- Divide total debt by equity
Debt to Equity Ratio Example
If a company reports:
- Total Debt: ₹800,000
- Shareholders’ Equity: ₹400,000
Debt to Equity Ratio=800,000÷400,000=2.0
This means creditors have twice as much financial stake in the business as shareholders.
Ideal Debt Equity Ratio: What is Considered Good?
There is no universal ideal debt equity ratio. What is considered healthy depends heavily on industry norms, cash flow stability, and business maturity.
General benchmarks:
- Below 1.0: Conservative financing
- 1.0–2.0: Balanced leverage
- Above 2.0: Aggressive or risky
Context always matters more than the number alone.
Ideal Debt Equity Ratio by Industry
Capital-intensive industries naturally operate with higher leverage:
Industry | Typical Ideal Debt Equity Ratio |
Manufacturing | 1.0 – 2.0 |
Banking | 2.0 – 5.0 |
Technology | 0.3 – 1.0 |
Utilities | 1.5 – 3.0 |
Comparing companies across different industries without adjustment leads to misleading conclusions.
How to Interpret Debt-to-Equity Ratio?
Understanding How to Interpret Debt-to-Equity Ratio? requires more than labeling numbers as “good” or “bad.”
High Debt to Equity Ratio Meaning
A high debt to equity ratio often indicates:
- Faster expansion financed through borrowing
- Higher fixed interest obligations
- Increased sensitivity to economic downturns
This isn’t automatically negative, but it raises the margin of error.
Low Debt to Equity Ratio Meaning
A low ratio suggests:
- Financial stability
- Lower default risk
- Conservative capital management
However, extremely low leverage may signal missed growth opportunities or inefficient capital use.
Advantages of Using Debt to Equity Ratio
- Simple and widely understood
- Effective for long-term solvency analysis
- Useful for benchmarking competitors
- Important for credit assessment
Limitations of Debt to Equity Ratio
- Ignores asset quality and profitability
- Can be distorted by accounting policies
- Less useful for asset-light businesses
- Does not reflect cash flow strength
Debt to Equity Ratio for Investors
Investors use the debt to equity ratio to evaluate downside risk. A rising ratio over time can signal overextension, while a declining ratio may indicate improving financial discipline.
Smart investors compare trends, not just snapshots.
Debt to Equity Ratio for Businesses
For management teams, debt to equity acts as a guardrail. It helps balance expansion goals with long-term survivability and keeps borrowing within sustainable limits.
FAQs on Debt-to-Equity Ratio
1. What is the Debt to Equity Ratio?
It measures how much debt a company uses relative to shareholder equity.
2. How to calculate debt to equity ratio?
Divide total liabilities by shareholders’ equity.
3. What is an ideal debt equity ratio?
Typically between 0.5 and 1.5, depending on the industry.
4. Is a high debt to equity ratio always bad?
No. It depends on cash flow stability and business model.
5. Can debt to equity ratio be negative?
Yes, when accumulated losses exceed equity.
6. Why is debt to equity important?
It reveals financial risk and capital structure efficiency.
Conclusion
The debt to equity ratio is more than a number — it is a lens into how a business balances risk and opportunity. When combined with profitability and cash flow analysis, it becomes a powerful decision-making tool for investors, lenders, and business leaders alike.
Used wisely, it doesn’t just describe financial structure — it helps shape better financial strategy.