What Is the NIFTY Auto Index? Stocks, Weightage & How It Works
I’ve tracked Indian sectoral indices through three semiconductor shortages, two EV investment cycles, and more auto-demand slumps than I care to count. If there’s one index that rewards patience and punishes people chasing headlines, it’s the NIFTY Auto Index. It’s cyclical, it’s concentrated, and it’s one of the most misunderstood sectoral benchmarks on the NSE. Let’s fix that.
This is an educational piece, not investment advice. Numbers below reflect market data as of mid-July 2026 and will move — always verify live figures before you act.
What Is the NIFTY Auto Index?
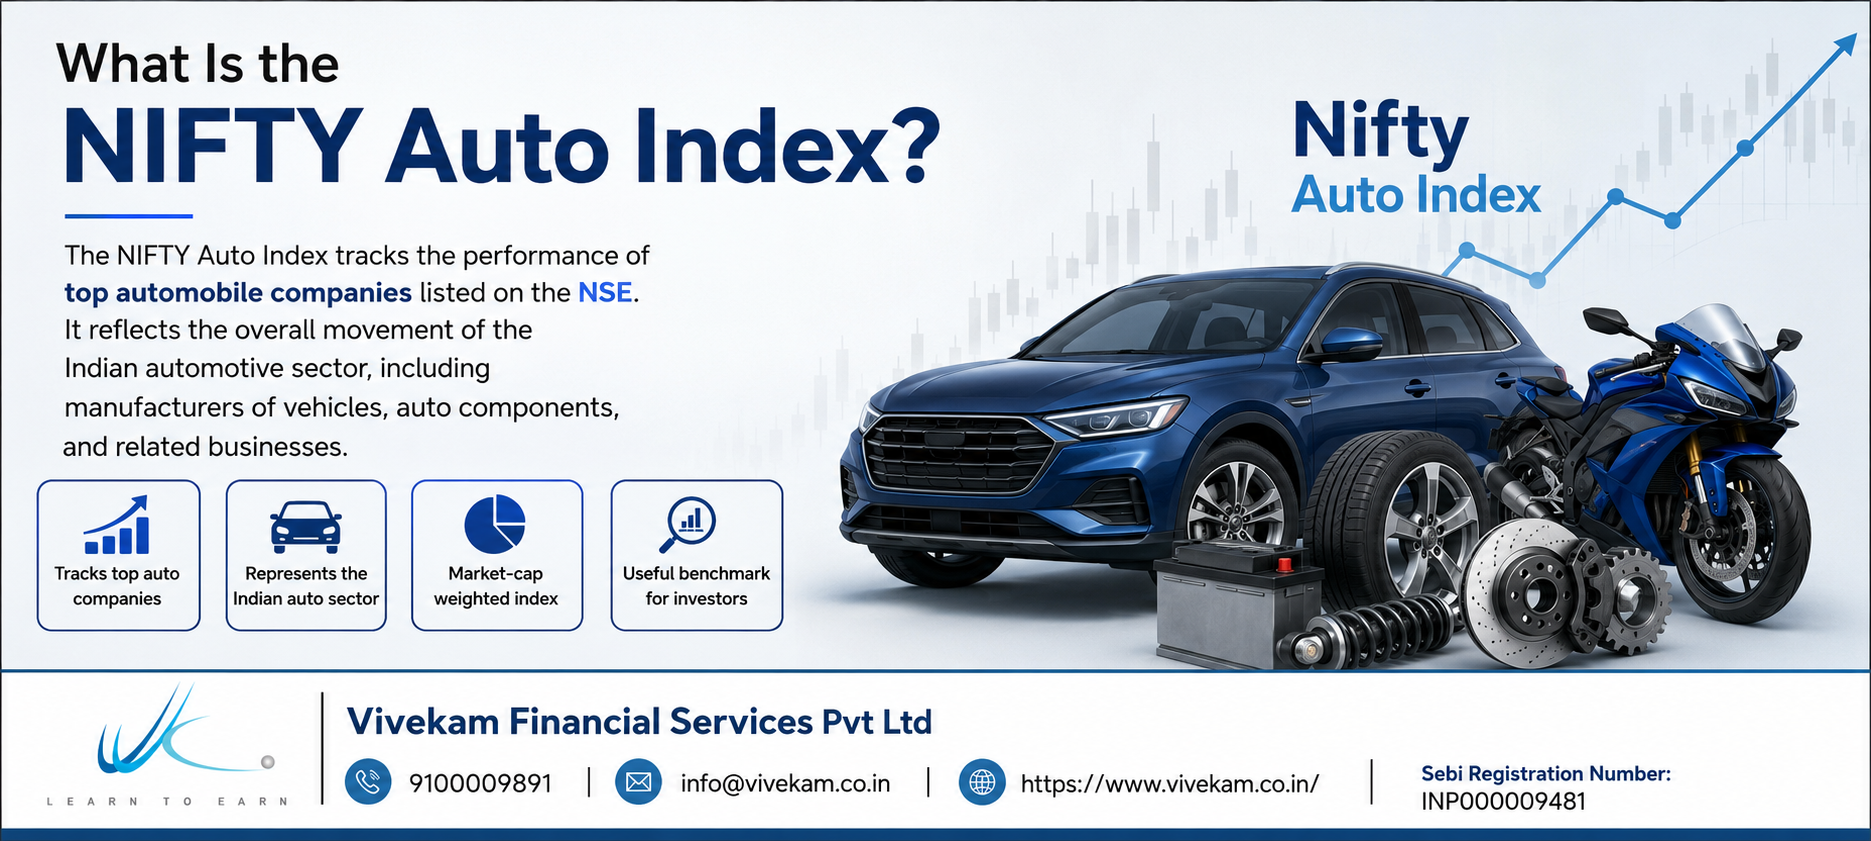
The NIFTY Auto Index is a sectoral benchmark maintained by NSE Indices Limited that tracks the automobile and auto-ancillary segment of the Indian equity market. It was launched with a base date of January 1, 2004, and a base value of 1,000 — which tells you something important right away: everything you see on the index today is the compounded result of over two decades of India’s auto industry, not a short-term story.
If you’re asking what is NIFTY Auto Index in plain terms: think of it as a single number that represents the combined, weighted performance of India’s biggest listed car makers, two-wheeler manufacturers, commercial vehicle producers, tyre companies, and auto-component suppliers. Instead of watching Maruti, Bajaj Auto, and Tata Motors separately, the index gives you one read on the entire ecosystem.
As of mid-July 2026, the index was trading in the 26,500–27,000 range, having touched a 52-week high near 29,179 and a 52-week low near 23,379. Since inception, it has compounded at roughly 15.7% CAGR — a number that includes brutal drawdowns during the 2008 financial crisis, the 2019-20 auto demand slump, and the pandemic, so treat it as a long-run average, not a promise.
How the NIFTY Auto Index Works
Here’s the mechanism, and this is the part most retail investors skip past without reading — which is a mistake, because the rules explain why the index behaves the way it does.
Selection universe: Constituents are drawn from the NIFTY 500 universe. A company has to belong to the automobile and auto-components sector, maintain at least 90% trading frequency over the preceding six months, and have a minimum six-month listing history (three months for IPOs that otherwise meet eligibility).
Weighting method: The index uses the free-float market capitalization method — the same approach used for the NIFTY 50. This means a company’s weight is based on the market value of shares actually available for public trading, not its total market cap. Promoter holdings, government stakes, and locked-in shares are excluded.
Concentration caps: This is the detail that actually protects you as an investor. No single stock can exceed 33% weight at the time of rebalancing, and the top three stocks combined cannot exceed 62%. Without this cap, an index like this could easily become a two-stock bet dressed up as a “sector fund.”
Rebalancing schedule: The index is reconstituted semi-annually, with cut-off dates of January 31 and July 31 each year. NSE gives the market four weeks’ notice before any change takes effect, so there’s no surprise reshuffling.
Number of constituents: Currently capped at 15 companies.
NIFTY Auto Index Companies: The Full List (2026)
Here is the current NIFTY Auto index constituents list with weightage as tracked in mid-July 2026. This is precisely the kind of data you should re-check before every trade, because weightage shifts with every price move and gets formally reset every rebalancing cycle.
Rank | Company | Weightage (%) | Segment |
1 | Maruti Suzuki India Ltd. | 18.05 | Passenger Vehicles |
2 | Mahindra & Mahindra Ltd. | 16.47 | PV / UV / Tractors |
3 | Bajaj Auto Ltd. | 12.17 | Two & Three-Wheelers |
4 | Eicher Motors Ltd. | 8.40 | Two-Wheelers / CVs |
5 | TVS Motor Company Ltd. | 7.32 | Two & Three-Wheelers |
6 | Samvardhana Motherson International Ltd. | 6.37 | Auto Components |
7 | Tata Motors Passenger Vehicles Ltd. | 5.28 | Passenger Vehicles |
8 | Bosch Ltd. | 5.15 | Auto Components |
9 | Bharat Forge Ltd. | 4.30 | Forging / Components |
10 | Hero MotoCorp Ltd. | 4.15 | Two-Wheelers |
11 | Ashok Leyland Ltd. | 3.92 | Commercial Vehicles |
12 | UNO Minda Ltd. | 2.79 | Auto Components |
13 | Tube Investments of India Ltd. | 2.37 | Auto Components |
14 | Sona BLW Precision Forgings Ltd. | 1.75 | Precision Forgings / EV Components |
15 | Exide Industries Ltd. | 1.51 | Batteries |
Weightage figures are approximate and change daily with price movement. Always confirm live weightage on the NSE Indices factsheet before making any decision.
NIFTY Auto Index Weightage: Why It’s Top-Heavy — And Why That Matters
Notice something: the top three names — Maruti Suzuki, Mahindra & Mahindra, and Bajaj Auto — together account for roughly 46-47% of the entire index. That’s well within the 62% regulatory cap, but it still means this is not a diversified basket in the way people assume “index investing” always is.
Practically, this means:
- Passenger vehicle demand cycles dominate the index’s short-term moves, because Maruti and M&M alone are almost a third of the weight.
- Two-wheeler sentiment (Bajaj Auto, Eicher, TVS, Hero MotoCorp) collectively carries roughly 32% weight, making rural demand and fuel price trends a real swing factor.
- Auto ancillaries (Motherson, Bosch, Bharat Forge, UNO Minda, Tube Investments, Sona BLW, Exide) make up the remaining chunk, and these names are more sensitive to global OEM order books, EV component transitions, and export demand than to Indian retail car sales alone.
If you’re buying this index expecting FMCG-style stability, you’re buying the wrong index. This is a cyclical, capex-and-consumption-linked sector, and the weightage table tells you exactly where the cyclicality is concentrated.
NIFTY Auto Share Price and Index Performance
A quick housekeeping note, because this trips up a lot of new investors: there is no single “NIFTY Auto share price” — the index itself isn’t a tradable share. What moves is the index level (quoted around 26,500-27,000 in mid-July 2026) and the individual NIFTY Auto stocks list components, or the ETF units and index fund NAVs that track the benchmark.
Historically, the index has had a track record of outperforming the broad NIFTY 50 in roughly seven of the eleven years studied in one long-run comparison — but it has also had sharper drawdowns during demand slowdowns (2013, 2019-20) than the broader market. That asymmetry — higher highs in upcycles, deeper cuts in downcycles — is the defining trait of every cyclical sector index, and auto is a textbook case.
How to Buy the NIFTY Auto Index
You cannot buy “the index” directly — indices aren’t tradable instruments. You have three practical routes, and each comes with a different cost and complexity profile.
1. NIFTY Auto ETF (Exchange-Traded Fund)
This is the most direct and typically the cheapest route. A NIFTY Auto ETF is bought and sold on the NSE like a stock, through your regular demat and trading account, at real-time market prices during trading hours.
- ICICI Prudential Nifty Auto ETF (ticker: AUTOIETF) — India’s first auto-sector ETF, launched in January 2022. It carries an expense ratio of around 0.20%, among the lowest-cost ways to get sector exposure.
- Nippon India ETF Nifty Auto BeES is another established option tracking the same benchmark.
ETFs require a demat account, and liquidity can be thinner than broad-market ETFs, so always check the bid-ask spread before placing a large order.
2. NIFTY Auto Index Fund
If you don’t have or don’t want to actively manage a demat account, a NIFTY Auto index fund works through your regular mutual fund folio — SIP or lump sum, no trading account needed.
- ICICI Prudential Nifty Auto Index Fund and Tata Nifty Auto Index Fund are examples that replicate the index by holding all 15 constituents in the same proportion as their index weightage.
- Minimum SIP amounts are typically as low as ₹1,000, and minimum lumpsum investments start around the same level, making this the most accessible route for smaller investors.
- Expect a slightly higher expense ratio than the ETF route, since index funds carry fund-management overhead that ETFs largely avoid.
3. Direct Stock Purchase
You can replicate the index yourself by buying the individual NIFTY Auto index stocks — Maruti, M&M, Bajaj Auto, and so on — in the same proportion as their weightage. This gives you full control (you can overweight or underweight specific names) but demands more capital, more monitoring, and manual rebalancing every six months to stay aligned with the actual index.
None of these three routes is objectively “best” — the right one depends on your account setup, ticket size, and whether you want passive replication or the flexibility to tilt your own weights.
NIFTY Auto Index vs. NIFTY EV & New Age Automotive Index
Don’t confuse the two. NSE also runs a separate NIFTY EV & New Age Automotive Index, launched with a base date of April 2, 2018, which is a broader, 33-stock index covering EV manufacturers, battery makers, and autonomous-vehicle technology suppliers — including names outside the traditional auto sector, such as select IT and chemicals companies involved in the EV supply chain. The traditional NIFTY Auto Index is the older, narrower, 15-stock benchmark focused on listed automobile and auto-ancillary manufacturers. If your goal is EV-specific exposure, that’s a different product; if you want the full traditional auto cycle — including legacy ICE two-wheelers, tractors, and commercial vehicles — NIFTY Auto is the one to use.
Risks Every Investor Should Weigh
Twenty years in this business teaches you that sector indices are only as good as your understanding of their cyclicality. Before you invest:
- Concentration risk: With three stocks near half the index weight, stock-specific news on Maruti or M&M moves the whole benchmark disproportionately.
- Cyclicality: Auto demand tracks interest rates, fuel prices, rural income, and monsoon performance closely. This is not a defensive sector.
- Regulatory and input-cost exposure: Emission norms, EV policy shifts, and commodity costs (steel, aluminium, semiconductors) can compress margins across the board simultaneously — a systemic risk that diversification within the sector doesn’t solve.
- No downside protection: Like any equity index, there’s no capital guarantee. The 52-week range alone (roughly 23,379 to 29,179 in the past year) shows the kind of swing you should be prepared for.
Frequently Asked Questions
What is the NIFTY Auto Index?
It’s an NSE sectoral index tracking 15 listed Indian companies from the automobile and auto-component space, weighted by free-float market capitalization.
How many stocks are in the NIFTY Auto Index?
Fifteen, selected from the NIFTY 500 universe and reviewed every six months.
What is the NIFTY Auto index weightage cap?
No single stock can exceed 33% weight, and the top three stocks combined cannot exceed 62%, both enforced at each semi-annual rebalancing.
Can I invest in the NIFTY Auto Index directly?
Not directly — you invest through a NIFTY Auto ETF, a NIFTY Auto index fund, or by buying the individual constituent stocks in matching proportions.
Is the NIFTY Auto Index a good long-term investment?
That depends entirely on your risk appetite and time horizon. It has compounded at roughly 15.7% CAGR since 2004, but with meaningfully deeper drawdowns than the broad market during auto-sector downcycles. Treat it as a cyclical satellite holding, not a core defensive position, and size it accordingly within a diversified portfolio.
This article is for educational purposes only and does not constitute investment advice. Index levels, weightage, and constituent lists change regularly — always verify current data through NSE Indices or your brokerage before making investment decisions. Past performance, including the CAGR and historical return figures cited above, is not indicative of future results.