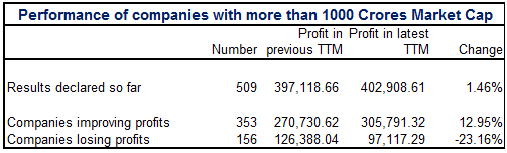
The positive performance continues as 353 companies out of 509 companies (with market cap above 1000cr), that is approximately about 70%; show an improvement in profits by 12.95%. The overall decrease in profits for the remaining 155 companies is -23.16%, from which if banking stocks are removed it drops to -14.36%.
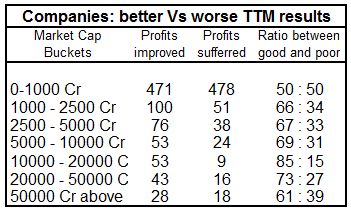
The buckets of market cap higher than 1000cr, like always, have been giving out a much better ratio, proving to be the much needed filter while taking investments into consideration. The overall fundamentals of companies with a market cap of over 1000cr seem to be undeterred by the recent meltdown, indicating a robust future for the stock market.